Visualizing data
1D and 2D data
After loading data into an EprData object. Plots can be made using plot method, as shown below.
# import EPRpy
import eprpy as epr

# Load data by providing path to .DSC or .DTA file
epr_data = epr.load('tempo.DSC')

# plot the data
epr_data.plot()
For complex data, imaginary part can be be visualized by setting plot_imag to True.
# import EPRpy and load data
import eprpy as epr
epr_t1 = epr.load('tempo_t1.DSC')

# plot the imaginary part as well
epr_data.plot(plot_imag=True)
See more plotting examples for 1D data.
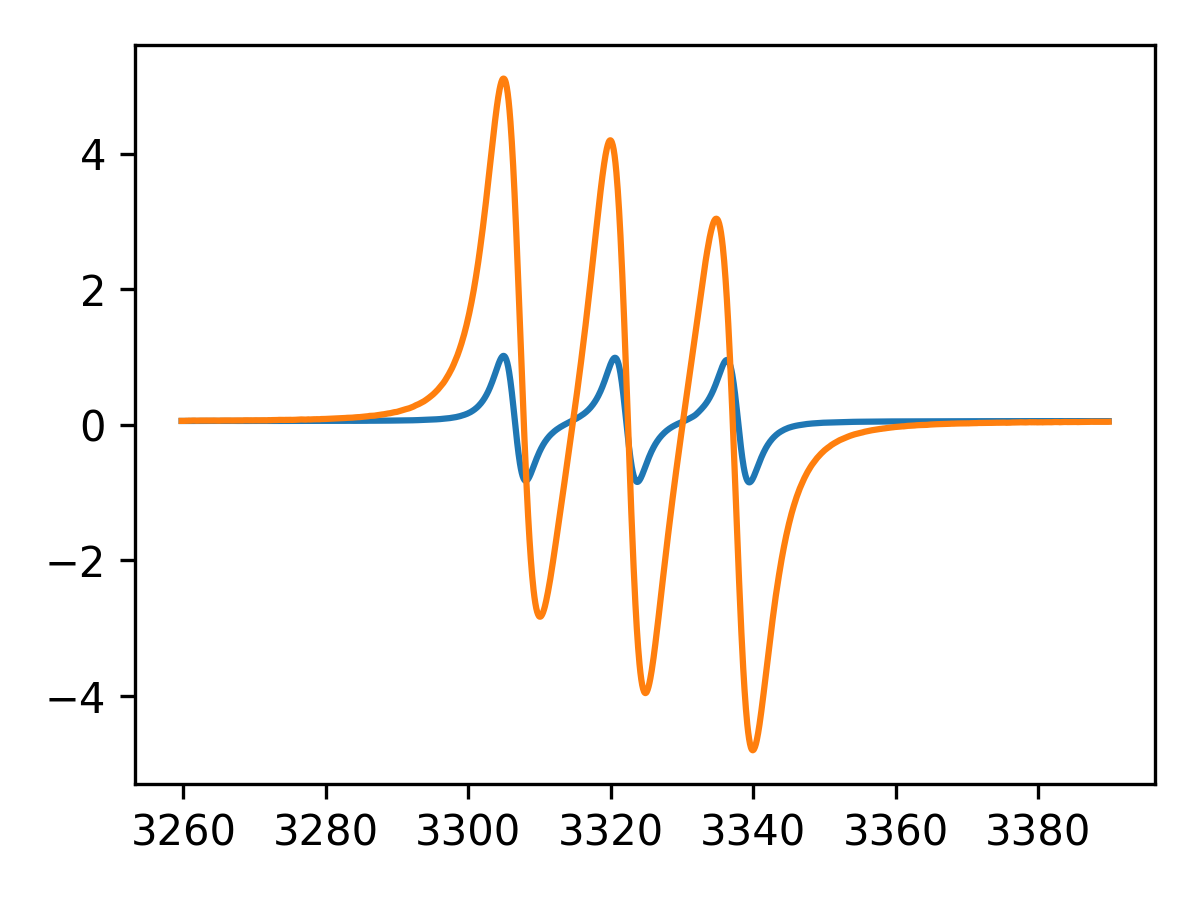
2D data can be visualized similarly and has a selection of plot types as shown below.
Addtionally, for 2D plots, specific slices can be selected by using the slices keyword and providing a range object as shown below.
# import EPRpy and load data
import eprpy as epr
epr_2d = epr.load('tempo_time.DSC')

# default is a stacked plot
# use `spacing` to control vertical spacing between each slice
# use `slices` to control data slices which should be plot
epr_data.plot(spacing=5,slices=range(35,48)) # spacing of 5, and slices 35 to 47.
Other plot types can be selected using the plot_type keyword as shown below.
# superimposed plot
epr_data.plot(plot_type='superimposed')

# pseudo color plot
epr_data.plot(plot_type='pcolor')

# surface
epr_data.plot(plot_type='surf')
See plotting examples for 2D data.
Multiple datasets
Any number of datasets can be compared on the same plot by using the eprplot function and provding the datasets as a list as shown below.
# import EPRpy and load the datasets
import eprpy as epr

# Load data by providing path to .DSC or .DTA file of each dataset
data1 = epr.load('tempo10mM.DSC')
data2 = epr.load('tempo1mM.DSC')

# use the eprplot function and input the datasets as a list
fig,ax = epr.eprplot([data1,data2])
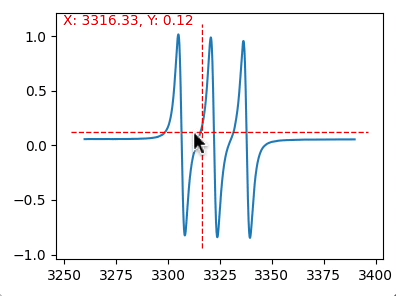
Interactive Plots
A data cursor for inspecting data on plots can be obtained by setting interactive to True while plotting as shown below. Move the cursor around to display the x-y value pairs in red. Left click and hold, and then drag while holding the right click mouse button to measure horizontal distance, shown in blue. For touchpads use : Ctrl + Left Click + Drag
# import EPRpy
import eprpy as epr

# Load data by providing path to .DSC or .DTA file
epr_data = epr.load('tempo.DSC')

# plot the data
epr_data.plot(interactive=True)
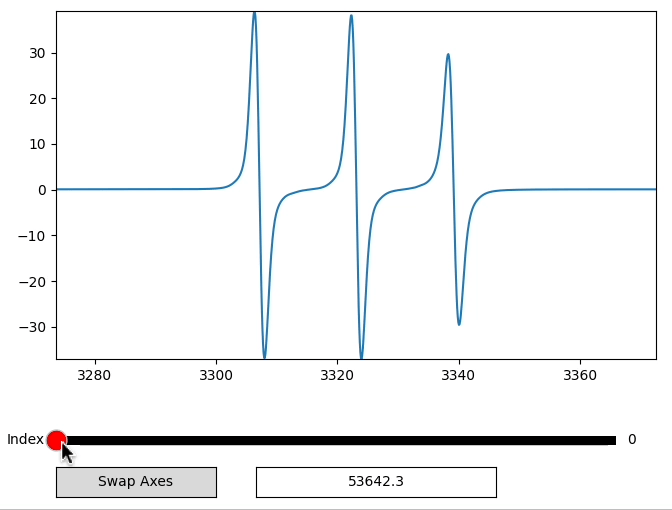
A slider for slicing through 2D data can be obtained as shown below for a TEMPO EPR spectrum as a function of time. The slider plot shows the value for the corresponding slice below the plot and a ‘Swap axes’ button to change the axis along which data slices are diplayed.
# import EPRpy
import eprpy as epr

# Load data by providing path to .DSC or .DTA file
epr_data = epr.load('tempo_time.DSC')

# plot the data
epr_data.plot(plot_type='slider',slices=range(35,48))